

It took a bit but NFLX finally hit my target which was the 200 period moving average on the Daily chart and is currently trading at $329.38. Your next target area for profit taking would be the $375 area...
It took a bit but NFLX finally hit my target which was the 200 period moving average on the Daily chart and is currently trading at $329.38. Your next target area for profit taking would be the $375 area...

I started with a small position 22 days ago in NFLX and I have been adding at buy setup areas as the stock has moved higher. The target is clearly overhead at the flat 200 period moving average. I enjoy the Swing style of trading Vs. micro trading on a 2 minute or tick chart and thus have taken less directional trading and have focused more on the Daily charts...

Great little short trade this morning right at the 10 am reversal time in the MES which is a great way to trade the emini when you're just getting started trading directionally.


My timing was a bit off when I sold my 247/248 Call Credit spread 2 weeks ago. I have not defended the position yet because of the MACD crossover occurring which is signalling a potential pull back to my first target of 244.50 area. I'm starting to get better using the MACD especially on the daily which is my choice time period for selling my Call and Put Credit spreads. I've got two weeks to go before my Call Credit spread expires, with a bit of luck I'll get out safely. I'll be looking to sell a Put Credit spread after the pull back and a recross upward signaled by the MACD.

A few days ago I found myself attempting to guess when to sell my Call Credit Spread in the SPY and it finally occurred to me that I was ignoring Market Law #4 on my longer swing trades which for me is my options trading. Market Law #4 states "If a stock fails to make a new low, after it has already made 3 or more lower lows, it will make a new high. Conversely, if a stock fails to make a new high, after it has already made a series of higher highs (3 or More), it will make a new low on the next move." Powerful! So last Monday, July 10th the market had a hard sell off intraday and recovered, it was near the end of the day that I realized that the daily chart had attempted to make a lower low but could not, that's when I knew we were going to make a new high. So to answer my question, when to sell my Call Credit Spread? The answer is after it makes a new higher high, not at the previous high, Duh! I say Duh, because I sold my CCS 2 days early 🙁
It's been awhile since I last posted, many changes have occurred in the trading business such as Pristine.com is no more and has become T3 trading. I've been a student of late of the Options market learning, trading, and mentoring. Finally realizing that I needed to back away a little from my directional trading. I've switch from trading Equities (Stocks) to trading futures, the ES in particular.
My trade of the day finally came this afternoon as I waited for the up trend to end on the 5 minute chart of the ES. The first setup I hesitated and missed out on but soon I found a 2nd entry just under and inside bar COG. This chart has so many things that can be learned from for the Pristine trained trader...

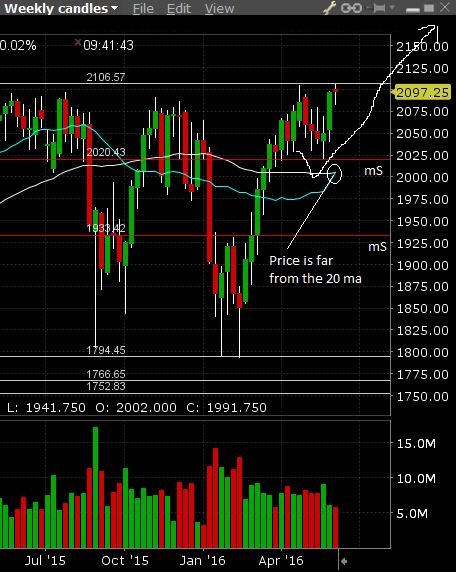
As price sold off and headed to my 1932.50 target area, price action was able to find minor support much higher at the 2020.50 area. Since price has rallied hard and should breakout above the 2106.50 area if the uptrend is going to continue on the weekly chart. My guess would be that price will have to wait until the rising 20ma catches up before the ES breaks out higher...
Price is currently trading @ 2037.50 and looks like it's going to test the Daily MS area at 2054.50. A break below MS will confirm our newly formed downtrend on the daily chart.
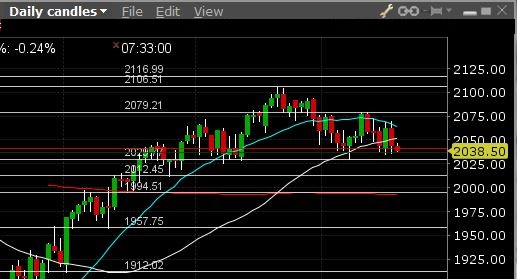
050182016 ES Daily
After a year hanging with the guys at the Day Trading Zones.com I've learned the importance of knowing where the puck (price) is going. Price is going to retest the 1933.50 area of minor Support mS on the weekly chart. It's not if its going to get there, the real question is when? Learning to trade this is trading mastery at the highest level...

05182016 ES Weekly
Day Trading Update: Wow!
It's been 9 years as of this upcoming June 30th since I started my trading journey towards mastery. I'm no longer struggling with my directional trading, I'm no longer worried that the wheels will fall off like so many times over the years. This is the most exciting time in my life to realize I've finally made it, making money every day. Many years I've spent doubting my method (The Pristine Method) and have spent more money on education, etc. Was it worth it, I guess the whole process is worth it. All I know is that I had to learn to trust my method with blind faith, focus on what is true, price Support and Resistance, and do what you are supposed to do when you are supposed to do it. I've spoken with many a profitable trader over the years and none of them have said the journey to profitability came in 2-3 years. All have said it was 10+ years of hard work, blood, sweat, and tears. So, I guess, I'm a year ahead of most... Wow!
I've been focusing so hard on the 60 minute chart while day trading the ES I almost overlooked today's break of the 2071 area which officially ends the uptrend on the ES on the daily chart. The weekly bar is going to close wide and red so I'm expecting further selling next week. My target on the weekly is a retest of the 1933.50 area which I'm sure a lot of you will probably think I'm nuts, but this is minor support on the weekly and that is where the target is, the question is how to profit from it...


For the past 7 days price has basically gone sideways on the daily chart of the ES but now appears price wants to move lower. The 2035 area is key, if price moves below this area of Major Support then the uptrend will be over for now on the daily time frame. Our next stop would be the 2012 area of the ES where buyers will step in.
